Multiple Choice
Exhibit 1A-9 Multi-curve graph 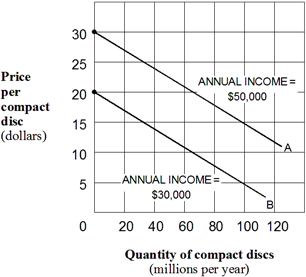 Exhibit 1A-9 represents a three-variable relationship. As the annual income of consumers falls from $50,000 (line A) to $30,000 (line B) , the result is a(n) :
A) rightward movement along each curve.
B) leftward movement along each curve.
C) leftward shift in curve A to curve B.
D) rightward shift in curve A to curve B.
Correct Answer:

Verified
Correct Answer:
Verified
Q45: An economic forecast:<br>A) will always be true.<br>B)
Q57: Someone notices that sunspot activity is high
Q57: Two variables that are inversely related tend
Q61: "As soon as a mayor announced his/her
Q67: When building a model, an economist must:<br>A)
Q85: Which of the following is not an
Q105: Exhibit 1A-2 Straight line <img src="https://d2lvgg3v3hfg70.cloudfront.net/TBX9287/.jpg" alt="Exhibit 1A-2 Straight
Q108: Which of the following represents positive economics?<br>A)
Q220: "An increase in the federal minimum wage
Q224: Normative economics is:<br>A) usually incorrect.<br>B) a statement