Multiple Choice
Exhibit 1A-10 Multi-curve graph 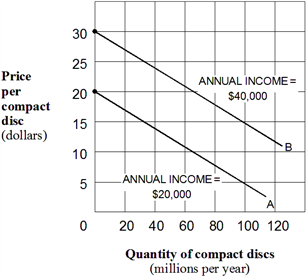 Exhibit 1A-10 represents a three-variable relationship. As the annual income of consumers rises from $20,000 (line A) to $40,000 (line B) , the result is a(n) :
A) rightward movement along each curve.
B) leftward movement along each curve.
C) leftward shift in curve B to curve A.
D) leftward shift in curve A to curve B.
Correct Answer:

Verified
Correct Answer:
Verified
Q14: The three basic categories of resources are
Q36: What is scarcity and why does it
Q43: A graph can be used to illustrate
Q47: A graph is one method of expressing
Q95: A factor of production is the same
Q119: The statement "A tax cut would be
Q159: The statement "Cutting government spending is the
Q175: Exhibit 1A-8 Straight line relationship <img src="https://d2lvgg3v3hfg70.cloudfront.net/TBX9287/.jpg" alt="Exhibit
Q209: A downward-sloping line has a negative slope.
Q244: A positive statement is:<br>A) something good or