Multiple Choice
Exhibit 3-4 Supply curves 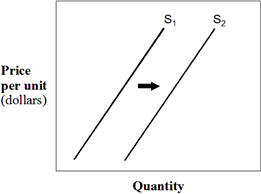 In Exhibit 3-4, which of the following could have caused the shift in the supply curve from S1 to S2?
A) Increase in demand.
B) Decrease in demand.
C) Decrease in the number of suppliers in the market.
D) Decrease in wage rates.
E) Increase in materials cost.
Correct Answer:

Verified
Correct Answer:
Verified
Q10: Two goods that are complementary are:<br>A) wrapping
Q47: A curve that is derived by summing
Q50: Which of the following will not cause
Q51: Exhibit 3-8 Demand and supply data for radios
Q74: If X and Y are substitutes, the
Q171: Assume that Coca-Cola and Pepsi-Cola are substitutes.
Q176: If income increases, then with regard to
Q256: An increase in the demand for peanut
Q322: The equilibrium price is best defined as
Q362: If the demand for a good increases