Multiple Choice
Exhibit 3-13 Supply and demand curves 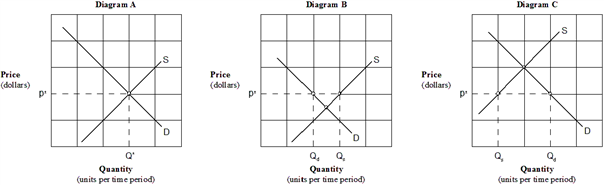 Which of the graphs in Exhibit 3-13 illustrates a shortage exists at the indicated market price?
A) Diagram A.
B) Diagram B.
C) Diagram C.
D) Diagrams A and B.
Correct Answer:

Verified
Correct Answer:
Verified
Q22: The price system eliminates scarcity.
Q43: If more people enter medical school, we
Q57: If the United Auto Workers union can
Q118: Exhibit 3-7 Demand and supply curves <img src="https://d2lvgg3v3hfg70.cloudfront.net/TBX9287/.jpg"
Q123: An advance in technology results in:<br>A) suppliers
Q125: Exhibit 3-2 Demand curves <img src="https://d2lvgg3v3hfg70.cloudfront.net/TBX9287/.jpg" alt="Exhibit 3-2 Demand
Q166: Assume Q<sub>s</sub> represents the quantity supplied at
Q200: If movies are an inferior good, movie
Q316: The horizontal summation of all individual demands
Q408: If the price of coffee decreases, the