Multiple Choice
Exhibit 5-1 Demand curves 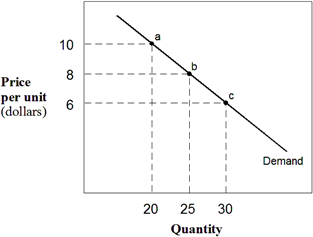 In Exhibit 5-1, between points a and b, the price elasticity of demand measures:
A) 0.67.
B) 1.5.
C) 2.0.
D) 1.56.
E) 1.0.
Correct Answer:

Verified
Correct Answer:
Verified
Related Questions
Q36: If a 10 percent price increase causes
Q97: If Pete raises his price of muffins
Q144: If an increase in the price of
Q149: Suppose you are the manager of a
Q197: If Stimpson University increases tuition in order
Q232: If an increase in the price of
Q260: If demand for a good is price
Q272: A perfectly elastic demand curve has an
Q276: Sally is an average shopper, with average
Q277: Price elasticity remains constant along a straight-line