Multiple Choice
Exhibit 5-8 Supply and demand curves for good X 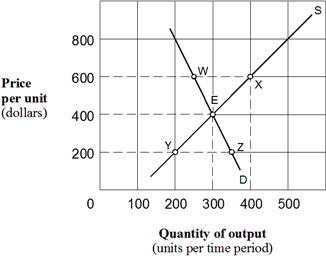 As shown in Exhibit 5-8, the price elasticity of demand for good X between points E and Z is:
A) 3/13 = 0.23.
B) 13/3 = 4.33.
C) 1/3 = 0.33.
D) 1.
Correct Answer:

Verified
Correct Answer:
Verified
Related Questions
Q1: As one moves down a straight-line, down-sloping
Q3: The price elasticity of demand coefficient for
Q95: A _ demand curve has a
Q105: Exhibit 5-3 Demand curves for gallons of orange
Q107: An economist estimates that .67 is the
Q108: What happens to total revenue given a
Q111: If a straight-line demand curve slopes down,
Q143: Suppose the president of a textbook publisher
Q209: If demand is price elastic, a decrease
Q255: If the managers of the bus system