Multiple Choice
Exhibit 5-9 Supply and demand curves for good X 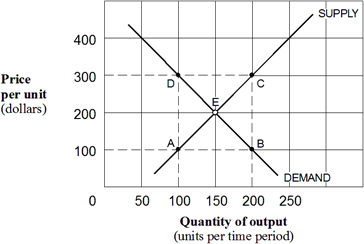 As shown in Exhibit 5-9, the price elasticity of demand for good X between points E and B is:
A) 3/7 = 0.43.
B) 7/3 = 2.33.
C) 1/2 = 0.50.
D) 1.
Correct Answer:

Verified
Correct Answer:
Verified
Related Questions
Q12: As price decreases and we move down
Q19: Exhibit 5-6 Demand curve for concert tickets <img
Q22: Elasticity has which special meaning for economists?<br>A)
Q23: If the price elasticity of demand for
Q77: If the price of Pepsi-Cola increases from
Q96: Which of the following describes a situation
Q123: A lower price elasticity of demand coefficient
Q133: If Sam, the Pizza Man, lowers the
Q144: If a demand curve for a good
Q195: Firms would like to know the price