Multiple Choice
Exhibit 5-9 Supply and demand curves for good X 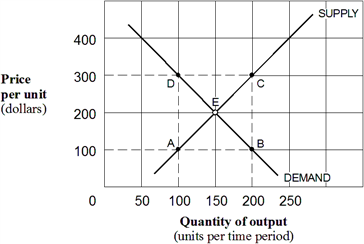 As shown in Exhibit 5-9, the price elasticity of demand for good X between points E and D is:
A) 1/5 = 0.20.
B) 3/7 = 0.43.
C) 1/2 = 0.50.
D) 1.
Correct Answer:

Verified
Correct Answer:
Verified
Q28: Elasticity measures how "sensitive" consumers are by
Q50: Exhibit 5-2 Price and quantity demanded data <img
Q51: Exhibit 5-4 Demand curves for silver <img src="https://d2lvgg3v3hfg70.cloudfront.net/TBX9287/.jpg"
Q52: Which of the following is true for
Q57: Exhibit 5-7 Demand curve for concert tickets <img
Q62: If the price elasticity of demand coefficient
Q91: If the price elasticity of demand for
Q123: Exhibit 5-4 Demand curves for silver<br> <img
Q148: If the percentage change in the quantity
Q208: The percentage change in the quantity demanded