menu-iconExamlexExamLexServices

Discover

Ask a Question
  1. All Topics
  2. Topic
    Business
  3. Study Set
    Survey of Economics Study Set 2
  4. Exam
    Exam 14: Aggregate Demand and Supply
  5. Question
    Exhibit 14-2 Aggregate Supply and Demand Curves
Solved

Exhibit 14-2 Aggregate Supply and Demand Curves

Question 13

Question 13

Multiple Choice

Exhibit 14-2 Aggregate supply and demand curves
Exhibit 14-2 Aggregate supply and demand curves   In Exhibit 14-2, the change in equilibrium from E<sub>1</sub> to E<sub>2</sub> represents: A)  cost-push inflation. B)  demand-pull inflation. C)  price-push inflation. D)  wage-push inflation.
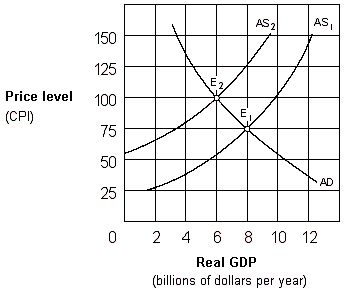
In Exhibit 14-2, the change in equilibrium from E1 to E2 represents:


A) cost-push inflation.
B) demand-pull inflation.
C) price-push inflation.
D) wage-push inflation.

Correct Answer:

verifed

Verified

Unlock this answer now
Get Access to more Verified Answers free of charge

Related Questions

Q10: Exhibit 14-1 Aggregate supply curve<br><img src="https://d2lvgg3v3hfg70.cloudfront.net/TBX9288/.jpg" alt="Exhibit

Q12: For an economy, aggregate demand equals:<br>A) consumption

Q17: When moving along a market demand curve,

Q21: Along the Keynesian range of the aggregate

Q46: Suppose the price level falls. The result

Q50: Which of the following events is the

Q54: Which of the following would shift the

Q70: Which of the following could not be

Q77: Which of the following will most likely

Q91: In the intermediate range of the aggregate

Examlex

ExamLex

About UsContact UsPerks CenterHomeschoolingTest Prep

Work With Us

Campus RepresentativeInfluencers

Links

FaqPricingChrome Extension

Download The App

Get App StoreGet Google Play

Policies

Privacy PolicyTerms of ServiceHonor CodeCommunity Guidelines

Scan To Download

qr-code

Copyright © (2025) ExamLex LLC.

Privacy PolicyTerms Of ServiceHonor CodeCommunity Guidelines