Multiple Choice
Exhibit 14-4 Aggregate supply and demand curves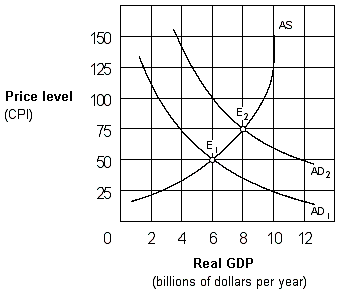
The increase in the price level as the economy moves from E1 to E2 in Exhibit 14-4 represents:
A) cost-push inflation.
B) demand-shock inflation.
C) wage push inflation.
D) demand-pull inflation.
Correct Answer:

Verified
Correct Answer:
Verified
Q20: If both the price level and nominal
Q32: Lower taxes on businesses will shift the
Q48: The effect of an increase in aggregate
Q83: Using the AD-AS model, if consumers and
Q86: Which of the following reasons helps explain
Q93: Exhibit 14-6 Aggregate supply curve<br><img src="https://d2lvgg3v3hfg70.cloudfront.net/TBX9288/.jpg" alt="Exhibit
Q96: Exhibit 14-6 Aggregate supply curve<br><img src="https://d2lvgg3v3hfg70.cloudfront.net/TBX9288/.jpg" alt="Exhibit
Q99: Exhibit 14-3 Aggregate supply and demand curves<br><img
Q102: Exhibit 14-6 Aggregate supply curve<br><img src="https://d2lvgg3v3hfg70.cloudfront.net/TBX9288/.jpg" alt="Exhibit
Q123: A short-run aggregate supply curve (SRAS)