Not Answered
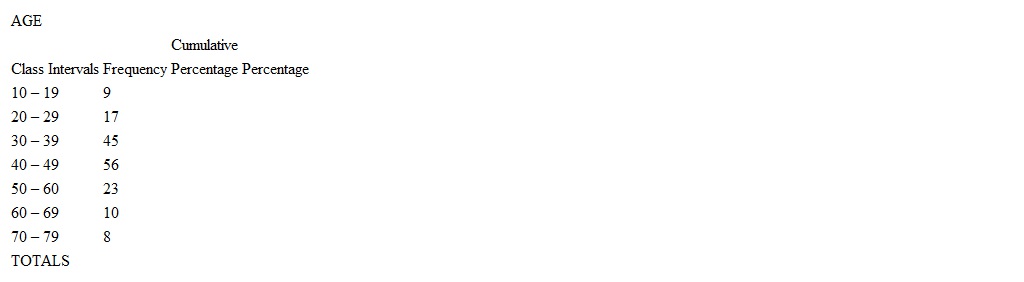
The frequency distribution below displays the distribution of age for a sample drawn from a community. Finish the table by completing the columns for percentages, and cumulative percentages.
Correct Answer:

Verified
Correct Answer:
Verified
Related Questions
Q6: Cumulative frequencies and cumulative percentages allow a
Q7: For a single variable measured at the
Q8: Twenty-three of the 50 states rejected a
Q9: For a single variable at the interval-ratio
Q10: A researcher wants to visually display the
Q12: Which of the following is an impossible
Q13: When constructing frequency distributions for variables measured
Q14: <img src="https://d2lvgg3v3hfg70.cloudfront.net/TBX9278/.jpg" alt=" -A possible problem
Q15: If class intervals overlap with one another,
Q16: A city of 1567 people had 34