Multiple Choice
In the graph shown below, the rising line represents a percent increase in which of the following? 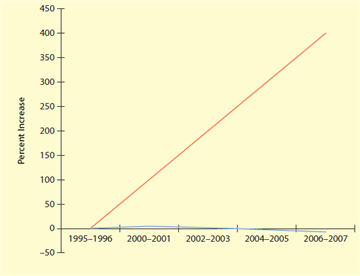
A) autism
B) specific learning disabilities
C) teen pregnancy
D) criminal convictions of youth ages 14-18
Correct Answer:

Verified
Correct Answer:
Verified
Q17: Consider Heinz's dilemma. According to Kohlberg's model,
Q18: Kohlberg's first two stages of moral development
Q19: What is theory of mind?
Q20: Definitions of social conventions are based on
Q21: One of the major criticisms of Kohlberg's
Q23: Gilligan criticized Kohlberg's theory as a masculine
Q24: According to Freud, psychological symptoms arise from<br>A)
Q25: Which of the following statements about preschoolers
Q26: Besides making cheating difficult and having severe
Q27: Five-year-old Sonny has begun to understand what