Multiple Choice
A graph like the one below most likely represents which of the following?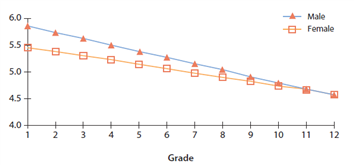
A) language ability
B) perceptions of competence
C) Erikson's psychosocial stages
D) gender constancy
Correct Answer:

Verified
Correct Answer:
Verified
Related Questions
Q14: Laxmi was not confident that she could
Q15: Stereotype threat has to do with race
Q16: Which age group tends to have the
Q17: What does it mean to show a
Q18: Let's say that African American students who
Q20: Which type of goal tends to result
Q21: Kenneth and Mamie Clark are famous for
Q22: Sally thinks that she has no ability
Q23: Which one of the following students clearly
Q24: To reduce prejudices among students, teachers should<br>A)