Multiple Choice
Use the figure below to answer the following question(s) . Figure 3-8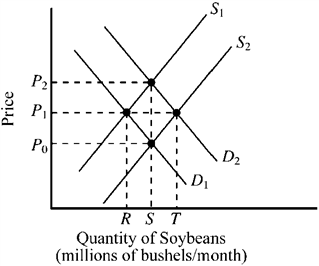 In Figure 3-8, if the initial demand and supply for soybeans were D1 and S1, how would a decrease in the cost of producing soybeans affect the market for soybeans?
A) Demand would increase to D2, price would increase to P2, and the quantity would increase to S.
B) Supply would increase to S2, price would decrease to P0, and the quantity would increase to S.
C) Both demand and supply would increase so the price would remain at P1, but the quantity would increase to T.
D) None of the above would occur.
Correct Answer:

Verified
Correct Answer:
Verified
Q64: If a large percentage increase in the
Q98: If Georgia experiences a late frost that
Q100: Which of the following about demand is
Q155: If you were a government official and
Q159: If we observe an increase in the
Q167: If the supply of a good decreased,
Q229: If an increase in the price of
Q340: A technological breakthrough lowers the cost of
Q374: A terrible storm wipes out 70 percent
Q405: If a major hurricane were to destroy