Multiple Choice
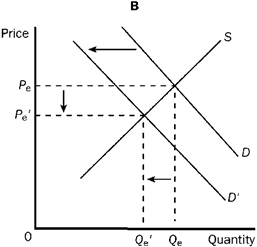
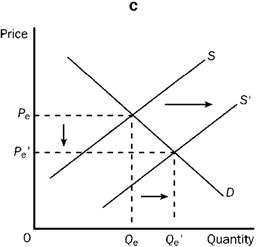
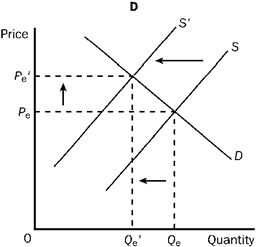
Figure 3-22 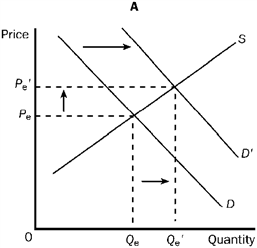
 Refer to Figure 3-22. Graph A shows which of the following?
A) An increase in demand and an increase in quantity supplied.
B) An increase in demand and an increase in supply.
C) An increase in quantity demanded and an increase in quantity supplied.
D) An increase in supply and an increase in quantity demanded.
Correct Answer:

Verified
Correct Answer:
Verified
Q10: A recent editorial in a local newspaper
Q70: If the number of consumers in a
Q115: Sam lives in a town with a
Q187: Figure 3-17 <img src="https://d2lvgg3v3hfg70.cloudfront.net/TBX9063/.jpg" alt="Figure 3-17
Q188: Figure 3-21 <img src="https://d2lvgg3v3hfg70.cloudfront.net/TBX9063/.jpg" alt="Figure 3-21
Q208: When a conflict arises in a major
Q260: Suppose both the equilibrium price and quantity
Q263: When economists say the quantity demanded of
Q294: Which of the following is the most
Q309: In which statement(s) are "demand" and "quantity