Multiple Choice
Figure 4-5 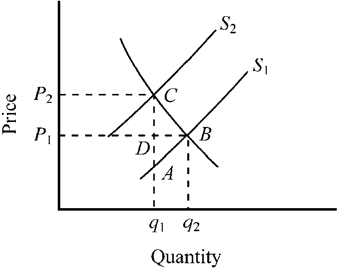 Figure 4-5 represents the market for gasoline before and after a per-gallon tax. What does the triangular area ABC represent?
A) the amount of revenue raised due to imposing the tax
B) the loss in consumer surplus due to imposing the tax
C) the loss in producer surplus due to imposing the tax
D) the deadweight loss (or excess burden) caused by the tax
Correct Answer:

Verified
Correct Answer:
Verified
Q69: When the price of a good is
Q92: A payment the government makes to either
Q104: Which of the following would tend to
Q112: Deadweight losses are associated with<br>A) taxes that
Q160: A $25 government subsidy paid directly to
Q197: Taxes adversely affect the allocation of resources
Q214: Figure 4-17 <img src="https://d2lvgg3v3hfg70.cloudfront.net/TBX9063/.jpg" alt="Figure 4-17
Q220: Use the figure below to answer the
Q221: Use the figure below to answer the
Q261: Suppose the equilibrium price of a physical