Multiple Choice
Use the figure below illustrating the impact of an excise tax to answer the following question(s) . Figure 4-6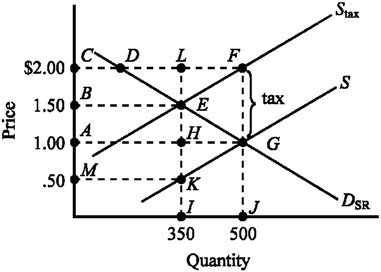 Refer to Figure 4-6. The amount of the excise tax I is
A) $.50.
B) $1.50.
C) $1.00.
D) $2.00.
Correct Answer:

Verified
Correct Answer:
Verified
Q49: In the supply and demand model, a
Q75: A deadweight loss results from the imposition
Q81: The state of Florida is considering putting
Q91: According to the Laffer curve,<br>A) an increase
Q143: A regressive tax<br>A) taxes individuals with higher
Q163: In 2010 the federal government reduced the
Q261: Use the figure below illustrating the impact
Q263: Figure 4-18 <img src="https://d2lvgg3v3hfg70.cloudfront.net/TBX9063/.jpg" alt="Figure 4-18
Q266: Use the figure below illustrating the impact
Q267: Figure 4-20 <img src="https://d2lvgg3v3hfg70.cloudfront.net/TBX9063/.jpg" alt="Figure 4-20