Multiple Choice
Use the figure below to answer the following question(s) . Figure 4-8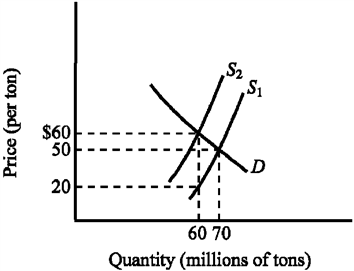 Refer to Figure 4-8. The supply curve S1 and the demand curve D indicate initial conditions in the market for soft coal. A $40-per-ton tax on soft coal is levied, shifting the supply curve from S1 to S2. Imposing the tax increases the equilibrium price of soft coal from
A) $20 to $60 per ton.
B) $20 to $50 per ton.
C) $50 to $60 per ton.
D) $50 to $90 per ton.
Correct Answer:

Verified
Correct Answer:
Verified
Q41: Suppose that the minimum wage was increased
Q50: If a $50 subsidy is legally (statutorily)
Q100: Which of the following statements is true?<br>A)
Q109: A price ceiling set below an equilibrium
Q184: The large amount of violence associated with
Q201: Figure 4-21 <img src="https://d2lvgg3v3hfg70.cloudfront.net/TBX9063/.jpg" alt="Figure 4-21
Q204: Figure 4-20 <img src="https://d2lvgg3v3hfg70.cloudfront.net/TBX9063/.jpg" alt="Figure 4-20
Q207: Figure 4-21 <img src="https://d2lvgg3v3hfg70.cloudfront.net/TBX9063/.jpg" alt="Figure 4-21
Q208: Figure 4-21 <img src="https://d2lvgg3v3hfg70.cloudfront.net/TBX9063/.jpg" alt="Figure 4-21
Q210: Use the figure below to answer the