Multiple Choice
Use the figure below to answer the following question(s) . Figure 4-8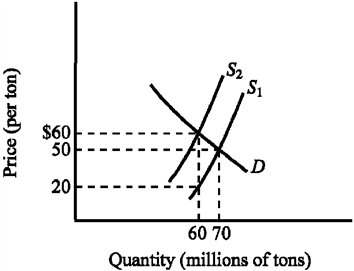 Refer to Figure 4-8. How much revenue does the $40-per-ton tax generate for the government?
A) $600 million
B) $700 million
C) $2.4 billion
D) $2.8 billion
Correct Answer:

Verified
Correct Answer:
Verified
Related Questions
Q29: The actual burden of a tax<br>A) falls
Q34: Figure 4-24 <img src="https://d2lvgg3v3hfg70.cloudfront.net/TBX9063/.jpg" alt="Figure 4-24
Q37: Use the table below to choose the
Q38: Which of the following examples illustrates a
Q60: A tax for which the average tax
Q61: Suppose an excise tax is imposed on
Q133: After a natural disaster, such as a
Q151: If an increase in the government-imposed minimum
Q161: Suppose that a tax is placed on
Q242: Which of the following about minimum wage