Multiple Choice
Use the figure below to answer the following question(s) . Figure 4-10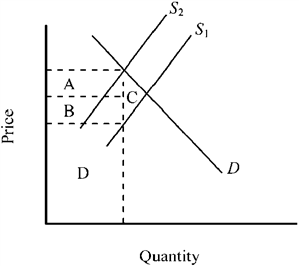 Figure 4-10 shows the market for a good before and after an excise tax is imposed. What does the triangular area C represent?
A) the deadweight loss accompanying the tax
B) the tax revenue derived from sellers
C) the tax revenue derived from buyers
D) the total tax revenue generated by the tax
Correct Answer:

Verified
Correct Answer:
Verified
Q36: The imposition of price ceilings on a
Q94: The more elastic the supply of a
Q100: Which of the following statements is true?<br>A)
Q109: A price ceiling set below an equilibrium
Q125: A tax imposed on the sellers of
Q167: In a market economy, which of the
Q197: Figure 4-25 <img src="https://d2lvgg3v3hfg70.cloudfront.net/TBX9063/.jpg" alt="Figure 4-25
Q201: Which of the following is the most
Q201: Figure 4-21 <img src="https://d2lvgg3v3hfg70.cloudfront.net/TBX9063/.jpg" alt="Figure 4-21
Q264: Which of the following statements is true?<br>A)