Multiple Choice
Use the figure below to answer the following question(s) . Figure 4-10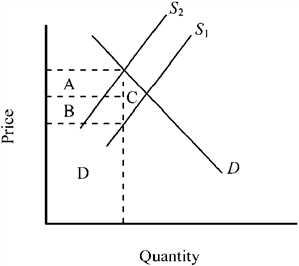 Refer to Figure 4-10. The accompanying graph shows the market for a good before and after an excise tax is imposed. The total tax revenue generated is indicated by
A) area A + area B + area D.
B) area A + area B + area C.
C) area A + area B.
D) area D only.
Correct Answer:

Verified
Correct Answer:
Verified
Q8: The Laffer curve illustrates the concept that<br>A)
Q49: Figure 4-2 <img src="https://d2lvgg3v3hfg70.cloudfront.net/TBX9063/.jpg" alt="Figure 4-2
Q55: Use the figure below to answer the
Q59: Figure 4-25 <img src="https://d2lvgg3v3hfg70.cloudfront.net/TBX9063/.jpg" alt="Figure 4-25
Q79: In 2010 the federal government reduced the
Q189: An effective minimum wage<br>A) imposes a price
Q192: If Aisha were to get a $3,000
Q199: If political officials want to minimize the
Q249: Suppose that the federal government grants a
Q263: The average tax rate is defined as<br>A)