Multiple Choice
Use the figure below to answer the following question(s) . Figure 4-11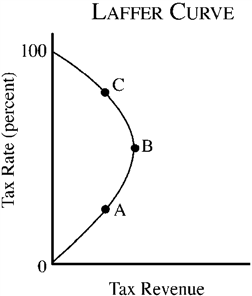 Refer to Figure 4-11. On the Laffer curve shown, tax revenue could be increased by
A) decreasing the marginal tax rates if we were currently at point A.
B) decreasing the marginal tax rates if we were currently at point C.
C) increasing the marginal tax rates if we were currently at point B.
D) increasing the marginal tax rates if we were currently at point C.
Correct Answer:

Verified
Correct Answer:
Verified
Q2: Figure 4-18 <img src="https://d2lvgg3v3hfg70.cloudfront.net/TBX9063/.jpg" alt="Figure 4-18
Q6: When a price floor is imposed above
Q7: Figure 4-25 <img src="https://d2lvgg3v3hfg70.cloudfront.net/TBX9063/.jpg" alt="Figure 4-25
Q39: When a supply and demand model is
Q54: The Laffer curve illustrates the relationship between<br>A)
Q84: Which of the following generalizations about the
Q93: Government programs such as Medicare substantially subsidize
Q119: Economists have argued that rent control is
Q214: A minimum wage that is set above
Q240: The more elastic the supply of a