Multiple Choice
Use the figure below to answer the following question(s) . Figure 4-12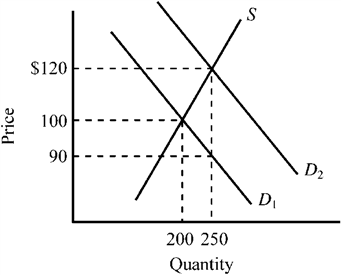 Refer to Figure 4-12. The supply curve S and the demand curve D1 indicate initial conditions in the market for college textbooks. A new government program is implemented that grants students a $30 per textbook subsidy on every textbook they purchase, shifting the demand curve from D1 to D2. Which of the following is true for this subsidy given the information provided in the exhibit?
A) The original average selling price of textbooks was $100, and after the subsidy it rises to $120.
B) $90 represents the net price a buyer must pay for a textbook after taking into account the subsidy payment.
C) Textbook buyers will receive an actual benefit of $10 from the subsidy, while textbook sellers will receive an actual benefit of $20 from the subsidy.
D) All of the above are true.
Correct Answer:

Verified
Correct Answer:
Verified
Q2: A subsidy on a product will generate
Q9: Other things constant, if a labor union
Q110: Under rent control, landlords cease to be
Q163: Figure 4-22 <img src="https://d2lvgg3v3hfg70.cloudfront.net/TBX9063/.jpg" alt="Figure 4-22
Q166: Figure 4-19 <img src="https://d2lvgg3v3hfg70.cloudfront.net/TBX9063/.jpg" alt="Figure 4-19
Q168: Use the figure below to answer the
Q169: Figure 4-24 <img src="https://d2lvgg3v3hfg70.cloudfront.net/TBX9063/.jpg" alt="Figure 4-24
Q185: When a government subsidy is granted to
Q222: The benefit of a subsidy will go
Q236: A legal system that provides secure private