Multiple Choice
Figure 4-14 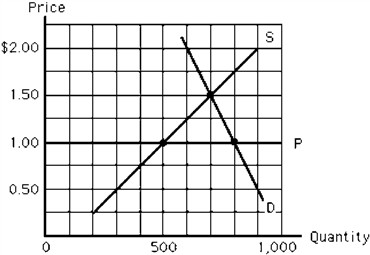 Figure 4-14 depicts the milk market. The horizontal line, P, represents a price ceiling imposed by the government. Which of the following is true?
A) In equilibrium, the quantity demanded is 800 gallons.
B) At the ceiling price, there is a surplus.
C) The quantity demanded at the price ceiling will equal the quantity supplied.
D) The equilibrium price would be $1 per unit without the price ceiling.
E) The quantity sold will be 500 gallons.
Correct Answer:

Verified
Correct Answer:
Verified
Q19: Price controls will tend to cause misallocation
Q33: Suppose the demand curve for a good
Q179: Suppose the U.S. government banned the sale
Q181: Suppose the United Auto Workers union obtains
Q223: Emma works full time during the day
Q233: Figure 4-25 <img src="https://d2lvgg3v3hfg70.cloudfront.net/TBX9063/.jpg" alt="Figure 4-25
Q234: An excise tax levied on a product
Q239: Use the figure below to answer the
Q256: If a household has $40,000 in taxable
Q258: The more elastic the supply of a