Multiple Choice
Figure 9-3 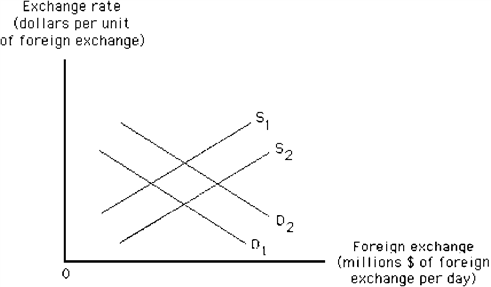 Suppose that U.S. tastes for British goods increase. Then, in Figure 9-3
A) the supply curve shifts from S1 to S2
B) the supply curve shifts from S2 to S1
C) the demand curve shifts from D2 to D1
D) the demand curve shifts from D1 to D2
E) both demand and supply shift to the right
Correct Answer:

Verified
Correct Answer:
Verified
Q168: Other things constant, a decrease in aggregate
Q169: Beginning in the latter part of 1999,
Q170: Which of the following is necessarily true
Q171: When an economy is in long run
Q172: An increase in the real interest rate
Q174: An unanticipated increase in the level of
Q175: Answer the following questions:<br>a.What is a bond?<br>b.If
Q176: Suppose that you purchase a $5,000 bond
Q177: An increase in the real interest rate
Q178: If equilibrium is present in the foreign