Multiple Choice
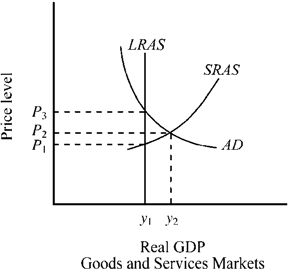
Use the figure below to answer the following question(s) . Figure 10-7 Given the aggregate demand and aggregate supply curves for the economy depicted in Figure 10-7, the economy's output and price level are
A) output y1 and price level P1.
B) output y2 and price level P2
C) output y1 and price level P3.
D) output y2 and price level P1.
Correct Answer:

Verified
Correct Answer:
Verified
Q101: Use the figure below to answer the
Q102: Which of the following will most likely
Q103: If the general level of prices is
Q104: Use the figure below to answer the
Q105: In the aggregate demand/aggregate supply model, when
Q107: An increase in the general level of
Q108: Under which of the following conditions will
Q109: Use the figure below to answer the
Q110: Explain how each of the following factors
Q111: Over the last 60 years, the average