Multiple Choice
Use the figure below to answer the following question(s) . Figure 10-8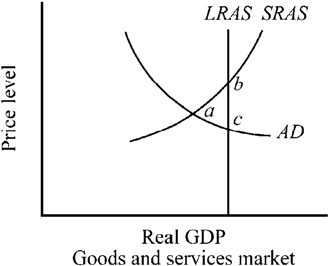 The economy depicted in Figure 10-8 is in
A) short-run equilibrium at less than the full-employment output level.
B) short-run equilibrium at an output level beyond full employment.
C) long-run equilibrium at point a.
D) long-run equilibrium at point b.
Correct Answer:

Verified
Correct Answer:
Verified
Q74: When the output of an economy exceeds
Q75: An increase in the long-run aggregate supply
Q76: For an oil-importing country such as the
Q77: When an economy is experiencing an economic
Q78: Figure 10-3 <img src="https://d2lvgg3v3hfg70.cloudfront.net/TBX9063/.jpg" alt="Figure 10-3
Q80: Within the AD/AS model, if an unanticipated
Q81: Figure 10-12 <img src="https://d2lvgg3v3hfg70.cloudfront.net/TBX9063/.jpg" alt="Figure 10-12
Q82: If the general level of prices is
Q83: Which of the following will most likely
Q84: If the U.S. price level increased relative