Multiple Choice
Use the figure below to answer the following question(s) . Figure 10-9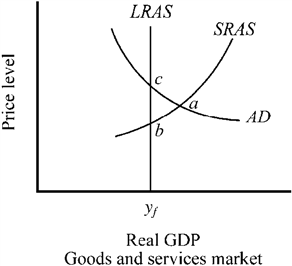 Currently, the economy depicted in Figure 10-9 is in
A) long-run equilibrium at point b.
B) short-run equilibrium at point c.
C) long-run equilibrium at point a.
D) short-run equilibrium at point a.
Correct Answer:

Verified
Correct Answer:
Verified
Q18: What would be the effect of a
Q19: Suppose the economy is initially in long-run
Q20: If Europe and Japan experience rapid growth
Q21: Which of the following will most likely
Q22: Figure 10-13 <img src="https://d2lvgg3v3hfg70.cloudfront.net/TBX9063/.jpg" alt="Figure 10-13
Q24: Which of the following will most likely
Q25: Which of the following would be most
Q26: Suppose this year's inflation rate is 4
Q27: How would aggregate demand change if foreign
Q28: Figure 10-18 <img src="https://d2lvgg3v3hfg70.cloudfront.net/TBX9063/.jpg" alt="Figure 10-18