Multiple Choice
Use the figure below to answer the following question(s) . Figure 10-10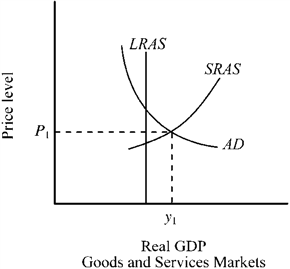 Given the aggregate demand and aggregate supply conditions depicted in Figure 10-10, which of the following will tend to occur?
A) an increase in resource prices, which will shift SRAS to the left
B) a decrease in resource prices, which will shift SRAS to the left
C) an increase in the real rate of interest, which will shift aggregate demand to the left
D) a decrease in the real rate of interest, which will shift aggregate demand to the left
E) Both b and c are correct.
Correct Answer:

Verified
Correct Answer:
Verified
Q168: If the U.S. price level decreased relative
Q169: During the past 50 years, the production
Q170: Use the figure below to answer the
Q171: Use the figure below to answer the
Q172: Show the short-run impact of the following
Q174: The economic boom between 2002 and 2006
Q175: Since the end of World War II,
Q176: Which of the following will most likely
Q177: Within the AD/AS model, how does an
Q178: Within the AD/AS model, an increase in