Multiple Choice
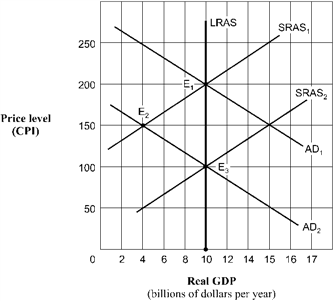
Figure 10-18  Beginning in Figure 10-18 from long-run equilibrium at point E1, the aggregate demand curve shifts to AD2. The economy's path to a new long-run equilibrium is represented by a movement from
A) E3 to E1 to E2.
B) E1 to E3 to E2.
C) E2 to E1 to E2.
D) E1 to E2 to E3.
Correct Answer:

Verified
Correct Answer:
Verified
Q12: When the U.S. dollar appreciates,<br>A) U.S. exports
Q13: An increase in capital formation that expands
Q14: Suppose the economy is in long-run equilibrium.
Q15: If an unanticipated reduction in aggregate demand
Q16: Figure 10-18 <img src="https://d2lvgg3v3hfg70.cloudfront.net/TBX9063/.jpg" alt="Figure 10-18
Q18: What would be the effect of a
Q19: Suppose the economy is initially in long-run
Q20: If Europe and Japan experience rapid growth
Q21: Which of the following will most likely
Q22: Figure 10-13 <img src="https://d2lvgg3v3hfg70.cloudfront.net/TBX9063/.jpg" alt="Figure 10-13