Multiple Choice
Figure 10-18 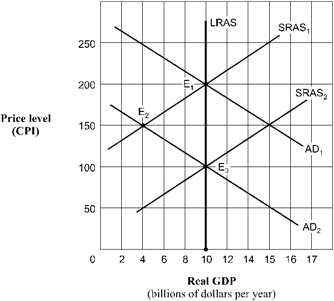 Beginning from long-run equilibrium at point E1 in Figure 10-18, the aggregate demand curve shifts to AD2. The real GDP and price level (CPI) in short-run equilibrium will be
A) $10 billion and 200.
B) $10 billion and 150.
C) $10 billion and 100.
D) $4 billion and 150.
Correct Answer:

Verified
Correct Answer:
Verified
Q62: Which of the following will most likely
Q63: Which of the following will most likely
Q64: Which of the following is most likely
Q65: When output is less than the economy's
Q66: Suppose there was a sharp reduction in
Q68: Which of the following will most likely
Q69: If a country's currency appreciates, which of
Q70: Which one of the following factors will
Q71: Which of the following adjustments will most
Q72: The expected price level is important because<br>A)