Multiple Choice
Figure 11-4 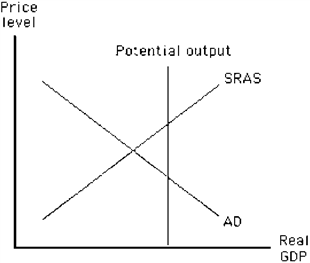 What happens in the economy illustrated in Figure 11-4 if government purchases increase by the amount necessary to achieve full employment?
A) The AD curve shifts to the right, the SRAS curve shifts to the left, and long-run equilibrium is achieved.
B) The AD curve shifts to the right, the price level increases, and long-run equilibrium is achieved.
C) The AD curve shifts to the right, the price level increases, and unemployment increases.
D) The AD curve shifts to the left, the price level increases, and employment decreases.
E) The SRAS curve shifts to the left, the price level decreases, and long-run equilibrium is achieved.
Correct Answer:

Verified
Correct Answer:
Verified
Q15: Long lags make discretionary policy less effective
Q16: When an economy dips into recession, automatic
Q17: Within the framework of the Keynesian model,
Q18: If policy makers believe that an inflationary
Q19: As the marginal propensity to consume (MPC)
Q21: If the government increases its spending, which
Q22: If Congress votes to increase government purchases
Q23: If an economy were experiencing a high
Q24: According to the Keynesian view, an unanticipated
Q25: Within the Keynesian model, if the marginal