Multiple Choice
Figure 15-3 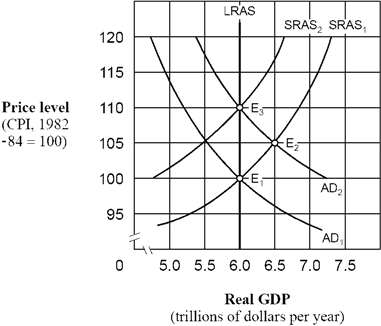 As shown in Figure 15-3, if people behave according to adaptive expectations theory, an increase in the aggregate demand curve from AD1 to AD2 will cause
A) labor to adjust nominal wages sluggishly.
B) the aggregate supply curve to shift from SRAS1 to SRAS2
C) the price level to eventually rise from 100 to 110.
D) All of the above.
Correct Answer:

Verified
Correct Answer:
Verified
Q92: According to the modern expectational Phillips curve,
Q93: The U.S. experience during the 1980s and
Q94: In the twentieth century, fluctuations in real
Q95: Activists and nonactivists both believe that<br>A) the
Q96: Which of the following is a major
Q98: As the size of a nation's outstanding
Q99: Which one of the following reduces the
Q100: Which of the following factors substantially reduces
Q101: Explain the three lags that make it
Q102: According to the adaptive expectations hypothesis,<br>A) inflation