Multiple Choice
Figure 15-3 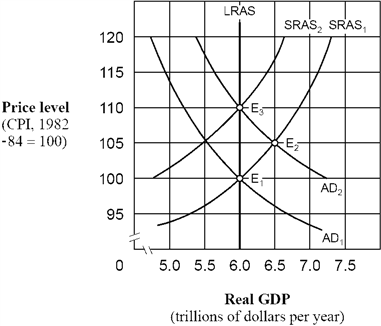 As shown in Figure 15-3, if people behave according to rational expectations theory, an increase in the aggregate demand curve from AD1 to AD2 will cause the price level to move
A) directly from 100 to 105 and then remain at 105.
B) directly from 100 to 110 and then remain at 110.
C) from 100 to 105 initially and then eventually move back to 100.
D) from 100 to 105 initially and then eventually move to 110.
Correct Answer:

Verified
Correct Answer:
Verified
Q1: Many people assert that the national debt
Q2: Assume that during the last several years,
Q3: According to the theory of rational expectations,
Q4: Which of the following is true of
Q5: During the 1950s and 1960s, the national
Q7: Indicate what might be done to restrain
Q8: Starting from an initial long-run equilibrium, under
Q9: Figure 15-3 <img src="https://d2lvgg3v3hfg70.cloudfront.net/TBX9063/.jpg" alt="Figure 15-3
Q10: An unanticipated shift to a more expansionary
Q11: According to the modern view of the