Multiple Choice
Figure 15-3 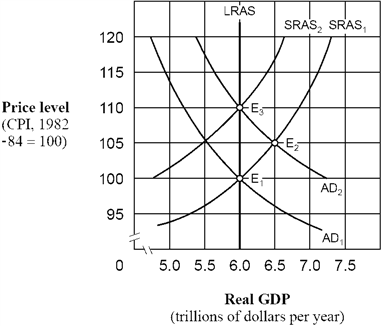 As shown in Figure 15-3, if people behave according to rational expectations theory, an increase in the aggregate demand curve from AD1 to AD2 will cause the economy to move
A) directly from E1 to E3 and then remain at E3.
B) directly from E1 to E2 and then remain at E2.
C) from E1 to E2 initially and then eventually move back to E1.
D) from E1 to E2 initially and then eventually move to E3.
Correct Answer:

Verified
Correct Answer:
Verified
Q25: What are the macroeconomic policy implications of
Q26: Under the adaptive expectations hypothesis, which of
Q27: Figure 15-3 <img src="https://d2lvgg3v3hfg70.cloudfront.net/TBX9063/.jpg" alt="Figure 15-3
Q28: Public choice analysis explains that<br>A) politicians have
Q29: Since the 1960s, macroeconomists have become more
Q31: Under the rational expectations hypothesis, which of
Q32: Use the figure below to answer the
Q33: When government debt is financed internally, future
Q34: The "implicit debt" accompanying the Social Security
Q35: Use the figure below to answer the