Multiple Choice
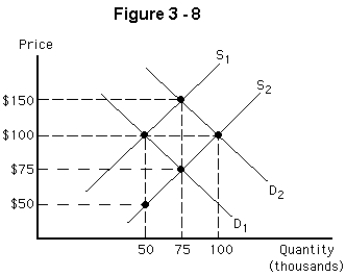
-In Figure 3-8,using the supply and demand curves denoted S₁ and D₁,respectively,the equilibrium price and quantity are
A) $100 and 50,000
B) $100 and 100,000
C) $120 and 50,000
D) $120 and 75,000
E) $120 and 100,000
Correct Answer:

Verified
Correct Answer:
Verified
Related Questions
Q17: <img src="https://d2lvgg3v3hfg70.cloudfront.net/TB3972/.jpg" alt=" -Which of the
Q18: An increase in the price of a
Q19: Assuming the most typical shapes of the
Q20: "As income rises,the demand for most goods
Q21: If two goods are substitutes,then a(n)<br>A) increase
Q23: An increase in quantity supplied can be
Q24: The quantity supplied of a good<br>A) is
Q25: The economic model of demand<br>A) explains the
Q26: The law of supply states that the
Q27: An increase in demand coupled with an