Multiple Choice
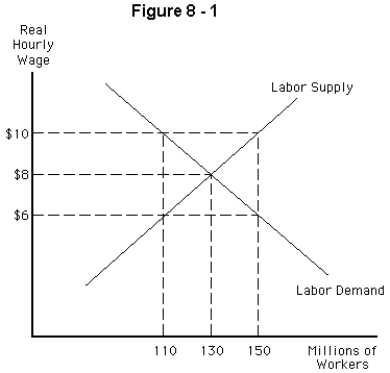
-Refer to Figure 8-1.According to the graph,the equilibrium real hourly wage and quantity of labor employed,respectively,are
A) $10,110 million workers
B) $8,130 million workers
C) $8,150 million workers
D) $6,150 million workers
E) $6,130 million workers
Correct Answer:

Verified
Correct Answer:
Verified
Q107: The labor supply curve<br>A) slopes upward to
Q108: Say's Law states that by purchasing goods
Q109: In the classical long-run model,<br>A) we focus
Q110: A critical assumption in the classical model
Q111: If an economy's consumption spending is $5
Q113: When the government is running a budget
Q114: <img src="https://d2lvgg3v3hfg70.cloudfront.net/TB3972/.jpg" alt=" -Refer to Figure
Q115: Assume the economy is currently in
Q116: What is the equilibrium condition in the
Q117: What is the relationship between the government's