Multiple Choice
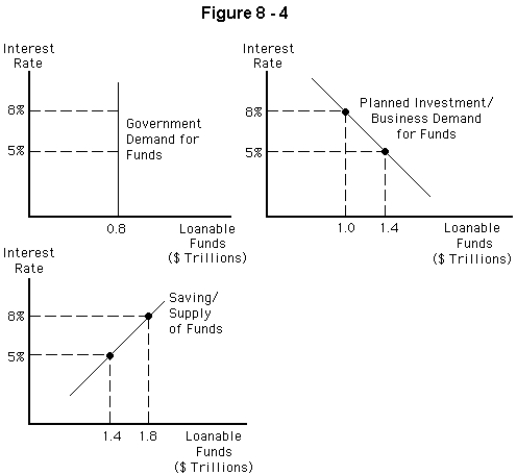
-Refer to Figure 8-4.Based on these graphs,what are the equilibrium interest rate and quantity of loanable funds exchanged?
A) 5 percent and $1.4 trillion
B) 5 percent and $2.2 trillion
C) 8 percent and $1.8 trillion
D) 8 percent and $2.8 trillion
E) It cannot be determined with the information given.
Correct Answer:

Verified
Correct Answer:
Verified
Q13: Which of the following are examples of
Q14: If the actual real wage exceeds the
Q15: Which of the following is a leakage
Q16: If at an interest rate of 7
Q17: In the classical model with an open
Q19: The aggregate production function shows us that
Q20: Which of the following markets must clear
Q21: <img src="https://d2lvgg3v3hfg70.cloudfront.net/TB3972/.jpg" alt=" -Refer to Figure
Q22: <img src="https://d2lvgg3v3hfg70.cloudfront.net/TB3972/.jpg" alt=" -After examining Figure
Q23: Which of the following does not usually