Multiple Choice
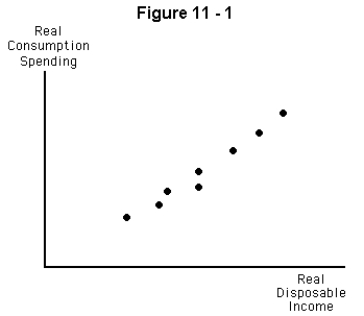
-Refer to Figure 11-1.The graph shows
A) a negative and relatively stable relationship between real consumption and real disposable income
B) a negative,but unstable,relationship between real consumption and real disposable income
C) a positive,but unstable,relationship between real consumption and real disposable income
D) a positive and relatively stable relationship between real consumption and real disposable income
E) no discernible relationship between real consumption and real disposable income
Correct Answer:

Verified
Correct Answer:
Verified
Q30: In the short run,<br>A) spending depends on
Q31: In the short run,<br>A) the labor market
Q32: <img src="https://d2lvgg3v3hfg70.cloudfront.net/TB3972/.jpg" alt=" -Refer to Figure
Q33: What are the marginal propensity to consume
Q34: If net taxes decrease by $500 billion,both
Q36: Use the table below to find the
Q37: Which of the following is the definition
Q38: Another expression for disposable income would be<br>A)
Q39: The value of the expenditure multiplier in
Q40: In the short-run macro model,cyclical unemployment<br>A) will