Multiple Choice
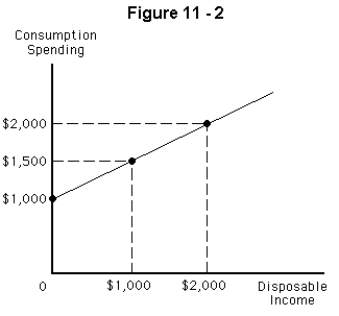
-Refer to Figure 11-2.Use the graph to determine the marginal propensity to consume.
A) 0.50
B) 0.60
C) 0.75
D) 0.80
E) 0.90
Correct Answer:

Verified
Correct Answer:
Verified
Related Questions
Q53: In the short run,<br>A) spending determines income,but
Q54: Which of the following changes would probably
Q55: If I = $2,000,G = $4,000,T =
Q56: An upward shift of the consumption function
Q57: Which of the following lines has a
Q59: If the marginal propensity to consume is
Q60: The slope of the aggregate expenditure line
Q61: The slope of the consumption function is
Q62: If aggregate expenditure is less than GDP,inventories
Q63: In the short-run macro model,which of the