Multiple Choice
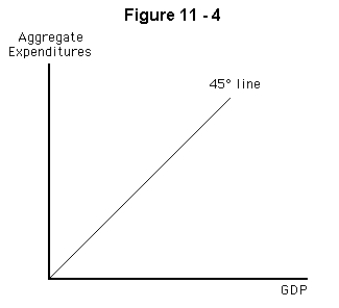
-The graph shown in Figure 11-4 shows
A) equilibrium in the short-run macro model
B) when inventories will accumulate and when they will shrink
C) how an increase in GDP will increase government tax revenues
D) how an increase in aggregate expenditure will increase GDP
E) every point at which aggregate expenditure equals GDP
Correct Answer:

Verified
Correct Answer:
Verified
Q141: If disposable income decreased,which of the following
Q142: Which of the following would lead to
Q143: If Americans became more pessimistic about the
Q144: If the marginal propensity to consume is
Q145: Which of the following would be most
Q147: The impact of saving on the economy
Q148: If the marginal propensity to consume is
Q149: Which of the following is considered to
Q150: <img src="https://d2lvgg3v3hfg70.cloudfront.net/TB3972/.jpg" alt=" -Refer to Figure
Q151: Net exports are<br>A) total exports minus total