Multiple Choice
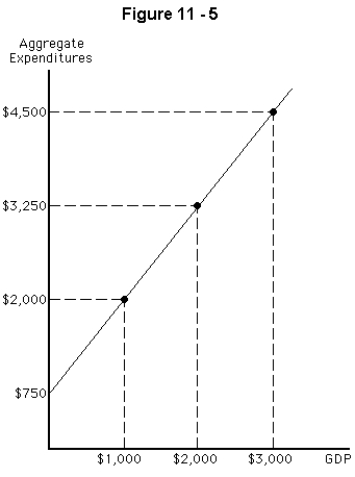
-Use the graph shown in Figure 11-5 to determine equilibrium in the economy.
A) $1,000
B) $2,000
C) $3,000
D) $3,250
E) There is no equilibrium in this economy
Correct Answer:

Verified
Correct Answer:
Verified
Related Questions
Q114: Since the value of the multiplier is
Q115: Which of the following would not cause
Q116: Whenever there is an increase in autonomous
Q117: Investment,as defined for calculating GDP,consists of only
Q118: Where can equilibrium GDP be found on
Q120: One benefit of automatic stabilizers is that
Q121: If the marginal propensity to consume is
Q122: Roughly what fraction of total spending is
Q123: If income increases by $10,000,government purchases are
Q124: A rise in aggregate expenditure is always<br>A)