Multiple Choice
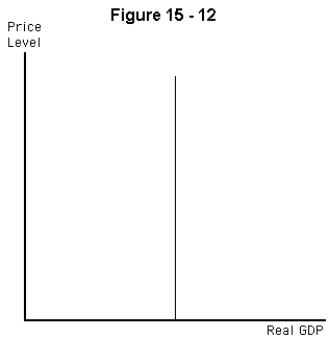
-Refer to Figure 15-12.The vertical line most likely represents the
A) money demand curve
B) short-run aggregate demand curve
C) long-run aggregate demand curve
D) short-run aggregate supply curve
E) long-run aggregate supply curve.
Correct Answer:

Verified
Correct Answer:
Verified
Q167: The average percentage markup in the economy
Q168: <img src="https://d2lvgg3v3hfg70.cloudfront.net/TB3972/.jpg" alt=" -Refer to Figure
Q169: If government spending increases,which of the following
Q170: If it costs $8 to produce a
Q171: In the short run,an increase in real
Q173: <img src="https://d2lvgg3v3hfg70.cloudfront.net/TB3972/.jpg" alt=" -Refer to Figure
Q174: A demand shock that increases real GDP
Q175: A spending shock<br>A) causes unemployment and inflation
Q176: <img src="https://d2lvgg3v3hfg70.cloudfront.net/TB3972/.jpg" alt=" -Refer to Figure
Q177: In the long run,changes in equilibrium GDP