Multiple Choice
The table below shows the velocities, in feet per second, of a ball that is thrown horizontally from the top of a 50 foot building and the distances, in feet, that it lands from the base of the building. Compute the linear regression equation for these data. 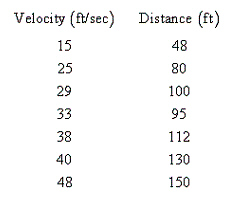
A) 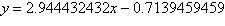
B) 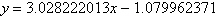
C) 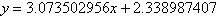
D) 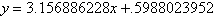
E) 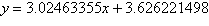
Correct Answer:

Verified
Correct Answer:
Verified
Q48: Find an equation of a circle that
Q49: An air freight company has determined that
Q50: Given <img src="https://d2lvgg3v3hfg70.cloudfront.net/TBX8727/.jpg" alt="Given ,
Q51: Use the vertical line test to determine
Q52: Find the difference quotient of <img src="https://d2lvgg3v3hfg70.cloudfront.net/TBX8727/.jpg"
Q54: Determine for which scatter diagram, A or
Q55: An air freight company has determined that
Q56: Determine whether the graph of <img src="https://d2lvgg3v3hfg70.cloudfront.net/TBX8727/.jpg"
Q57: Given <img src="https://d2lvgg3v3hfg70.cloudfront.net/TBX8727/.jpg" alt="Given ,
Q58: Use the vertical line test to determine