Multiple Choice
Explain how to use the graph of  to produce the graph of
 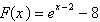 .
.
A) Shift the graph of f horizontally 2 units to the right and then shift this graph vertically downward 8 units.
B) Shift the graph of f horizontally 8 units to the right and then shift this graph vertically upward 2 units.
C) Shift the graph of f horizontally 2 units to the right and then shift this graph vertically upward 8 units.
D) Shift the graph of f horizontally 8 units to the left and then shift this graph vertically downward 2 units.
E) Shift the graph of f horizontally 2 units to the left and then shift this graph vertically downward 8 units.
Correct Answer:

Verified
Correct Answer:
Verified
Q14: Evaluate the logarithm <img src="https://d2lvgg3v3hfg70.cloudfront.net/TBX8727/.jpg" alt="Evaluate the
Q15: Write the equation below in its logarithmic
Q16: Use algebraic procedures to find the exact
Q17: Evaluate the following logarithmic expression. <img src="https://d2lvgg3v3hfg70.cloudfront.net/TBX8727/.jpg"
Q18: The following table shows the time T
Q20: The function <img src="https://d2lvgg3v3hfg70.cloudfront.net/TBX8727/.jpg" alt="The function
Q21: The population P of a city grows
Q22: Use algebraic procedures to find the exact
Q23: Use algebraic procedures to find the exact
Q24: The population of groundhogs on a ranch