Multiple Choice
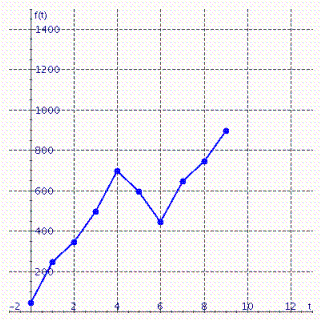
Graph shows the number of sports utility vehicles  sold in the United States.
  represents sales in year
  in thousands of vehicles. Find
  .
. 
A) 
B) 
C) 
D) 
E) 
Correct Answer:

Verified
Correct Answer:
Verified
Related Questions
Q40: Given <img src="https://d2lvgg3v3hfg70.cloudfront.net/TBX8650/.jpg" alt="Given ,
Q41: Decide which of the two given functions
Q42: The table shows the number of fiber-optic
Q43: Following are approximate values of the Amex
Q44: Given <img src="https://d2lvgg3v3hfg70.cloudfront.net/TBX8650/.jpg" alt="Given ,
Q46: The Snowtree cricket behaves in a rather
Q47: U.S. imports of pasta increased from 290
Q48: In 2004 the Texas Bureau of Economic
Q49: Find the linear equation that is the
Q50: Following are some approximate values of the