Multiple Choice
The following table shows the approximate average household income in the U.S. in 1995, 2002, and 2003. (  represents 1995.)
 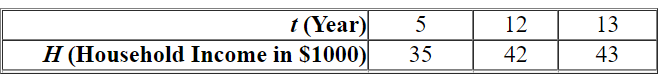 Which of the following kinds of models would best fit the given data? ( A , a , b , c , and m are constants.)
A) Quadratic: 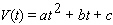
B) Logarithmic: 
C) Power: 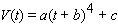
D) Linear: 
E) Exponential: 
Correct Answer:

Verified
Correct Answer:
Verified
Q90: Calculate the slope of the straight line
Q91: Given <img src="https://d2lvgg3v3hfg70.cloudfront.net/TBX8650/.jpg" alt="Given ,
Q92: Find the linear equation that is the
Q93: The chart shows second quarter total retail
Q94: In the Fahrenheit temperature scale, water freezes
Q95: Graph shows the number of sports utility
Q97: In 1950 the number of retirees was
Q98: The value of U.S. trade with China
Q99: Match each function with the corresponding graph.
Q100: Given <img src="https://d2lvgg3v3hfg70.cloudfront.net/TBX8650/.jpg" alt="Given ,