Multiple Choice
The graph shows the actual percentage of U.S. households with a computer as a function of household income (the data points) and a logistic model of these data (the curve) . The logistic model is  where
where  is the household income in thousands of dollars. According to the model, what percentage of extremely wealthy households had computers?
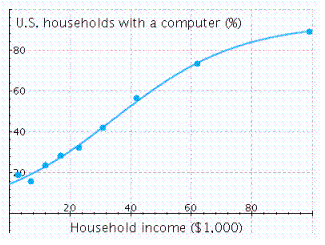
A)  is close to
  .
.
B)  is close to
  .
.
C)  is close to
  .
.
D)  is close to
  .
.
E)  is close to
  .
.
Correct Answer:

Verified
Correct Answer:
Verified
Q54: Convert the exponential function to the form
Q55: The following chart shows the value of
Q56: The given table corresponds to the function
Q57: Pack-Em-In Real Estate is building a new
Q58: Choose the correct letter for each question.
Q60: Find the logistic function <img src="https://d2lvgg3v3hfg70.cloudfront.net/TBX8650/.jpg" alt="Find
Q61: The U.S. population was 180 million in
Q62: You are the sales manager for Montevideo
Q63: The market research department of the Better
Q64: Find N , A , and b