Short Answer
The following graph shows the actual percentage of U.S. households with a computer as a function of household income (the data points)and a logistic model of these data (the curve). The logistic model is 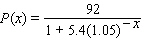 where
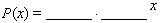
where  is the household income in thousands of dollars. For low incomes, the logistic model is approximately exponential. Which exponential model best approximates
  for small
  ? Round the coefficients to the nearest hundredth.
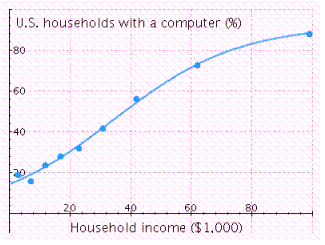
Correct Answer:

Verified
Correct Answer:
Verified
Q13: Find the logistic function <img src="https://d2lvgg3v3hfg70.cloudfront.net/TBX8650/.jpg" alt="Find
Q14: For the following demand equation, express the
Q15: Model the data using an exponential function
Q16: For the following demand equation, find the
Q17: Which of the following three functions will
Q19: Pack-Em-In Real Estate is building a new
Q20: Model the data using an exponential function
Q21: Model the data using an exponential function
Q22: The given table corresponds to the function
Q23: Find the associated doubling time. <img src="https://d2lvgg3v3hfg70.cloudfront.net/TBX8650/.jpg"