Multiple Choice
The chart shows the total annual support for the arts in the U.S. by federal, state, and local government in 1995-2003 as a function of time in years (  represents 1995) together with the regression line.
 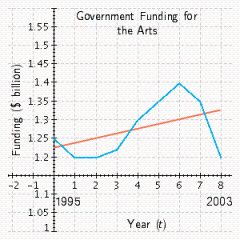 Over the period
  the average rate of change of government funding for the arts was _____ the rate predicted by the regression line.
A) equal to
B) greater than
C) less than
Correct Answer:

Verified
Correct Answer:
Verified
Q60: Estimate the slope of the tangent to
Q61: Estimate <img src="https://d2lvgg3v3hfg70.cloudfront.net/TBX8650/.jpg" alt="Estimate of
Q62: Determine what, if any, value to assign
Q63: Compute the derivative function <img src="https://d2lvgg3v3hfg70.cloudfront.net/TBX8650/.jpg" alt="Compute
Q64: Calculate the average rate of change of
Q66: Calculate the average rate of change of
Q67: At which labeled point is the slope
Q68: Determine what, if any, value to assign
Q69: Use a graph to determine whether the
Q70: The graph of a function <img src="https://d2lvgg3v3hfg70.cloudfront.net/TBX8650/.jpg"